 New Horizons
 Project Management Academy
 Six Sigma Online
 TCM Security
 TRACOM
 Velopi
 Watermark Learning
 Login
Login


Project teams need to actively identify a problem and understand the root cause of the problem if they are to solve it. In the Project Management Professional ® (PMP) certification exam, cause and effect diagrams are a tool used to better understand the root of a problem.
On this page:

Free Download:
The Ultimate Data Quality Guide
Learn about the 7 data quality
tools every project manager
should know!
What are Cause and Effect Diagrams
The Project Management Institute® (PMI)’s description of the Cause and Effect diagram is found in the 6th edition of the Project Management Body of Knowledge (PMBOK® Guide):
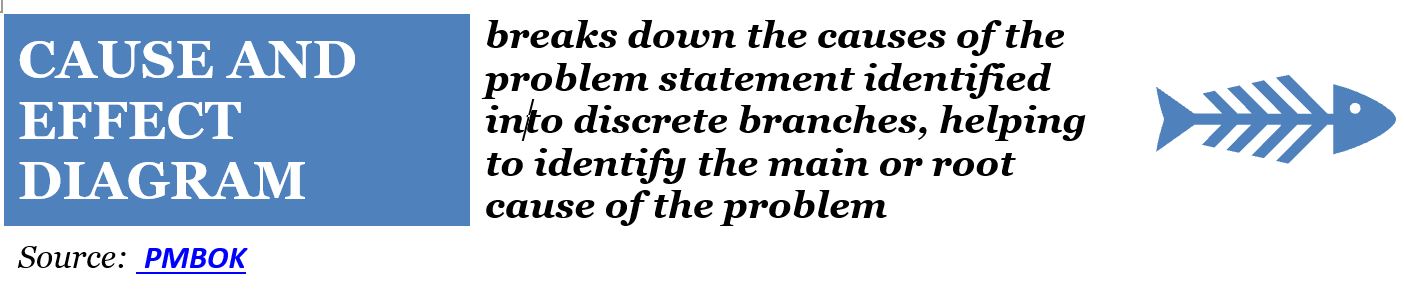
A cause and effect diagram for the Project Management Professional® (PMP) certification holder is one of the Seven Quality Tools used for data collection and analysis. It is used in the Project Quality Management process, found in the Sixth Edition of the PMBOK® Guide. Developed in 1960 by Japanese professor Kaoru Ishikawa, the tool helps a team find the root cause of a problem using probing questions and a diagraming technique.
One reason the Cause and Effect diagram is such a powerful tool is that it enables a process of “determining and exhausting the different underlying causes of a particular problem so that the appropriate corrective measures are delivered.” Not only are the different causes identified, but the corrective actions needed for each are brought forward. Complex problems rarely have a single mitigation solution; the cause and effect diagram is a graphic representation of the complexity so it is possible to manage it.
Something is Fishy: Fishbone Diagrams for Project Management
Cause and Effect diagram questions on the PMP exam assume test takers know the different names for Ishikawa’s quality tool, including:
- Cause and Effect
- Ishikawa diagram
- Fishbone diagram
- Fishikawa diagram
- Herringbone diagram
The name “fishbone” is inspired by the graphic nature of the quality tool for cause and effect: the final image resembles that of a fish skeleton. The name “Herringbone” diagram also stems from the fishbone appearance of the completed graphic, whereas the term “Fishikawa” is a combination of the shape of the image and the name of the creator, Ishikawa. Any of these terms may appear in the context of PMP exam or in formal settings where project management tools and techniques are employed. The key point to know is Ishikawa created the fishbone diagram tool to prompt teams to “consider all possible causes of a problem, instead of focusing on the obvious one.” A team that quickly acts without knowing the cause of the problem or the effect of changes will suffer more negative outcomes than the team that seeks to enhance their understanding.
Creating a Cause and Effect Diagram
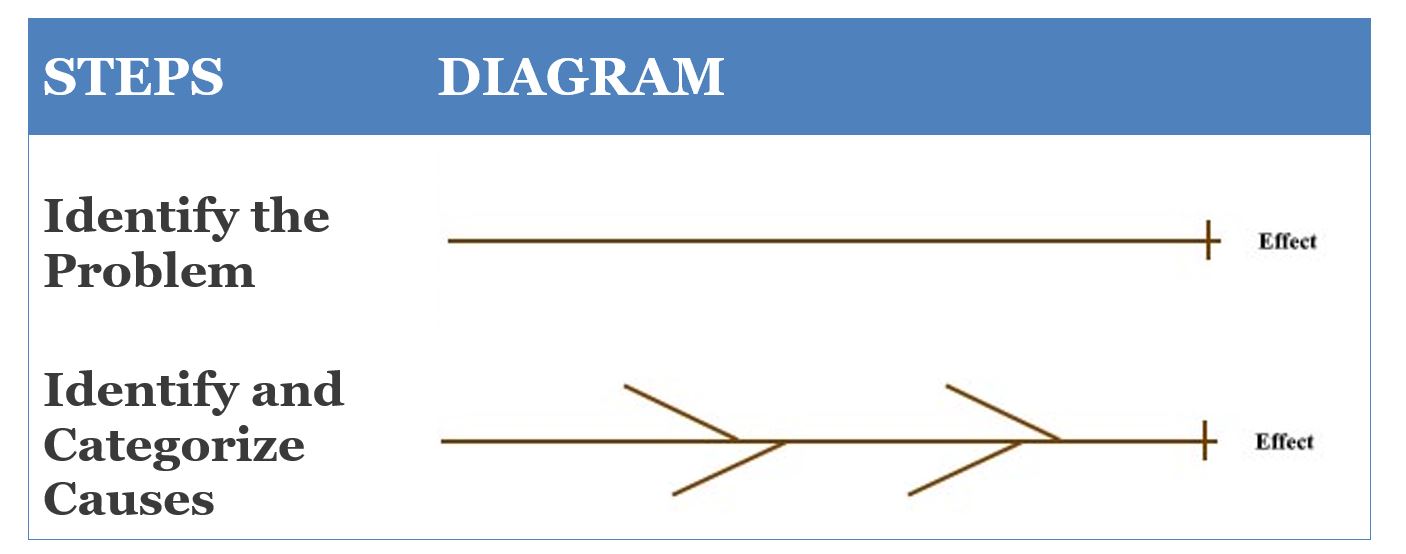
For a PMP credential holder, cause and effect diagrams are made easier when keeping a fishbone shape in mind. Start with the backbone (problem), with the right side being the head (effect), and ribs poking out along the spine (causes).
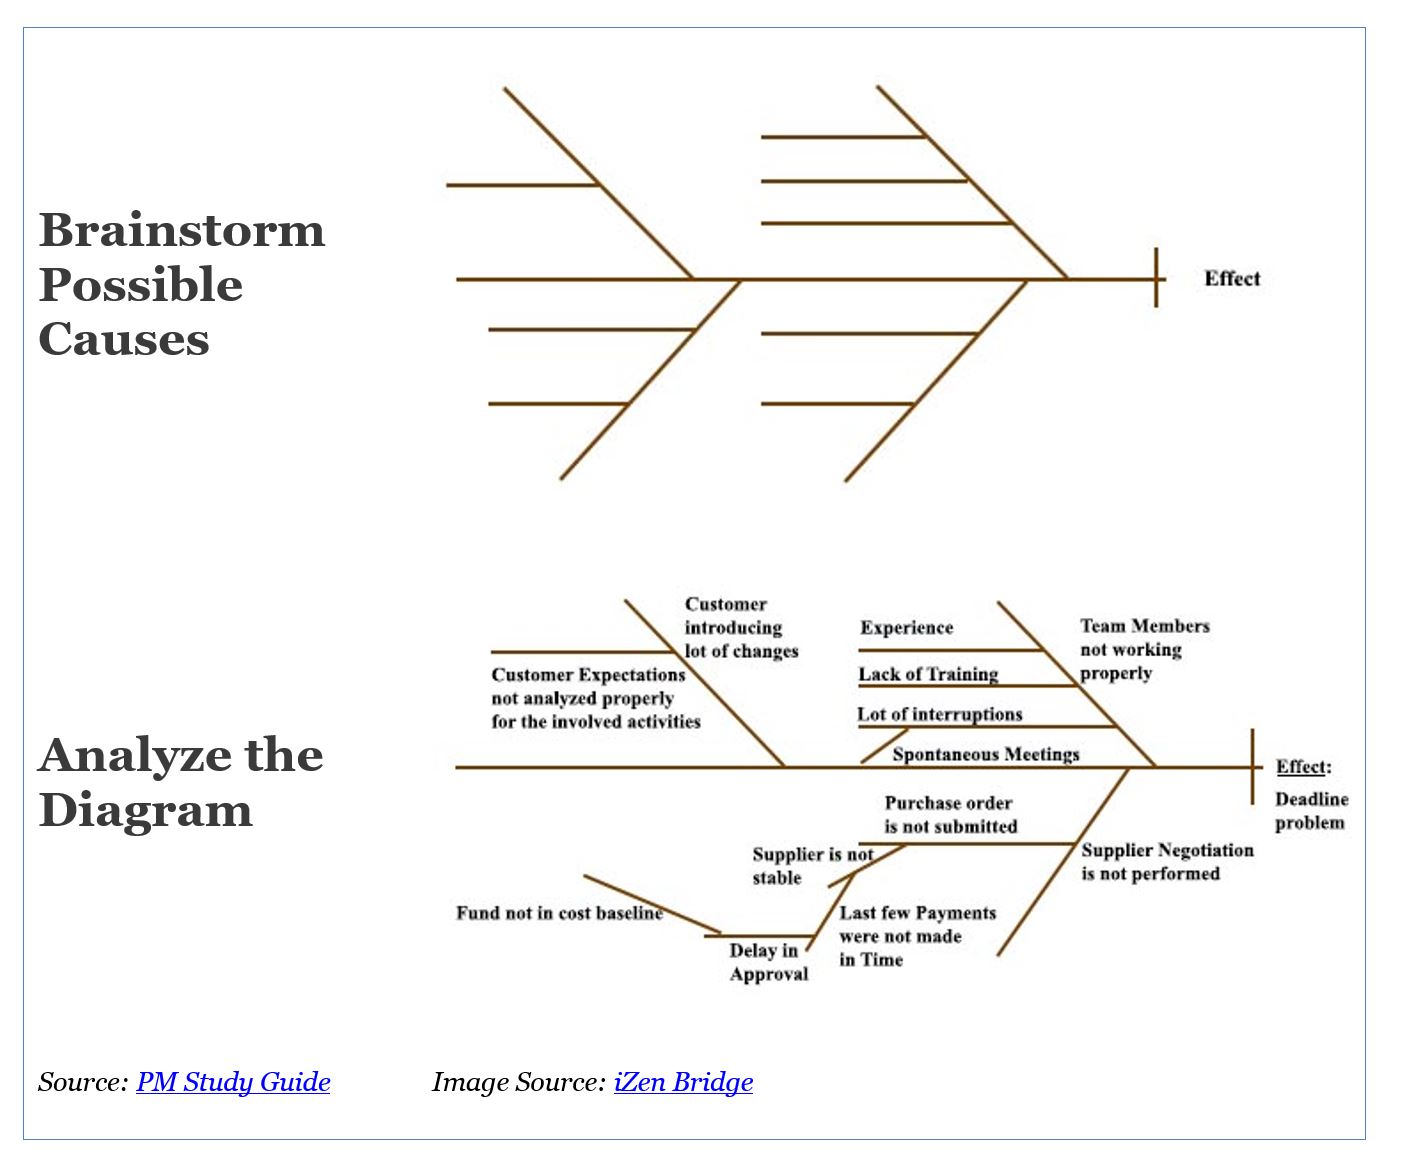
The causes, those “bones” coming out from the spine, can be organized into categories. In manufacturing, the categories are often methods, machine, materials, and measurements. For a service setting, the categories could be skills, suppliers, surroundings, and systems. The diagram can have more than four categories, as can be found in service organizations using the groupings of price, people, product, procedure, promotion, policy, place, and processes.
When considering the Ishikawa diagram project managers know the final step, analysis, can be the most time-consuming. The team needs to discuss a cause and the factors for each; otherwise, the problem will likely continue and may even expand in impact.
Studying for the PMP Exam?
Cause and Effect Diagram Examples
For those with project management experience, with or without an active PMP certification, cause and effect diagrams are a powerful quality management tool. Each fishbone diagram will look different, but the basic concept and graphic structure guide the overall diagram creation process. Review each example shown below and find the problem, cause, and effect.
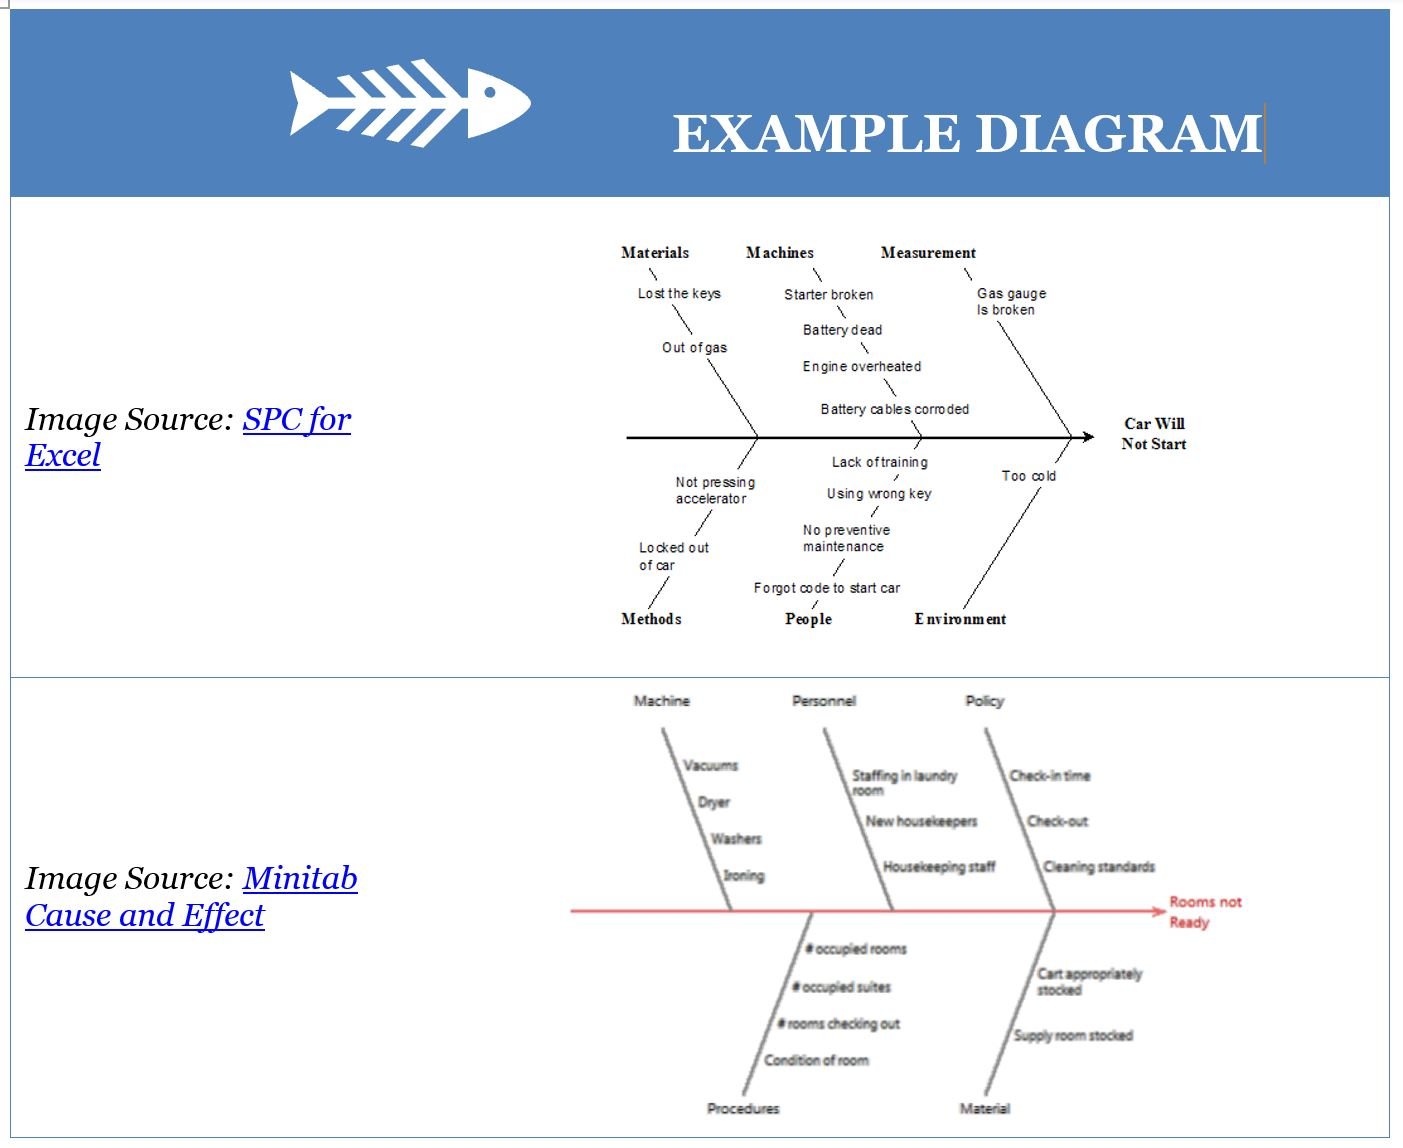
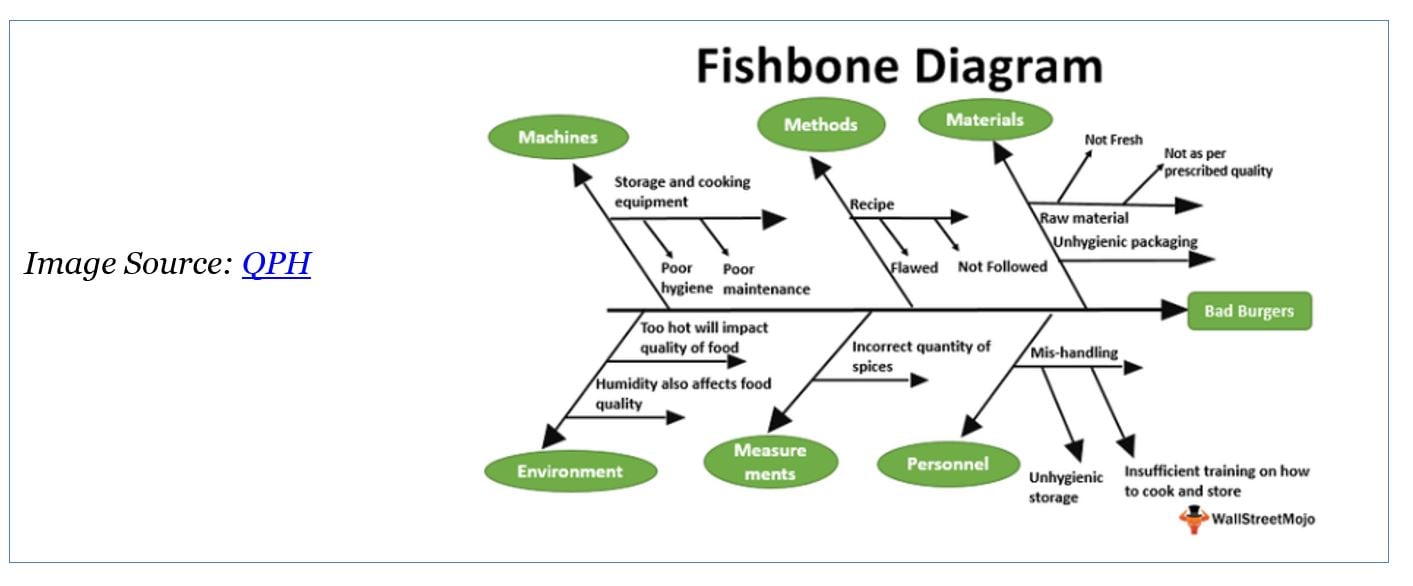
Each example shown has a different appearance. The use of software can enhance the team’s work on a fishbone diagram. Yet the cause and effect diagram can also be created using a whiteboard (in person or virtually). The Project Manager needs to know the process and facilitate the discussion no matter if it is a sketch done in a meeting or a polished finished graphic. To better ensure accurate insights, (1) the team needs to have in-depth knowledge of the problem being examined, (2) the project manager should facilitate the discussion to keep it on track, and (3) the problem itself should be clearly defined before starting to determine the cause.
Benefits of Cause and Effect Diagram
There are 7 Quality Tools, which speak to the range of situations Ishikawa recognized in his work. The PM Study Circle lists the benefits of the cause and effect, or fishbone, diagram shown here as a chart:
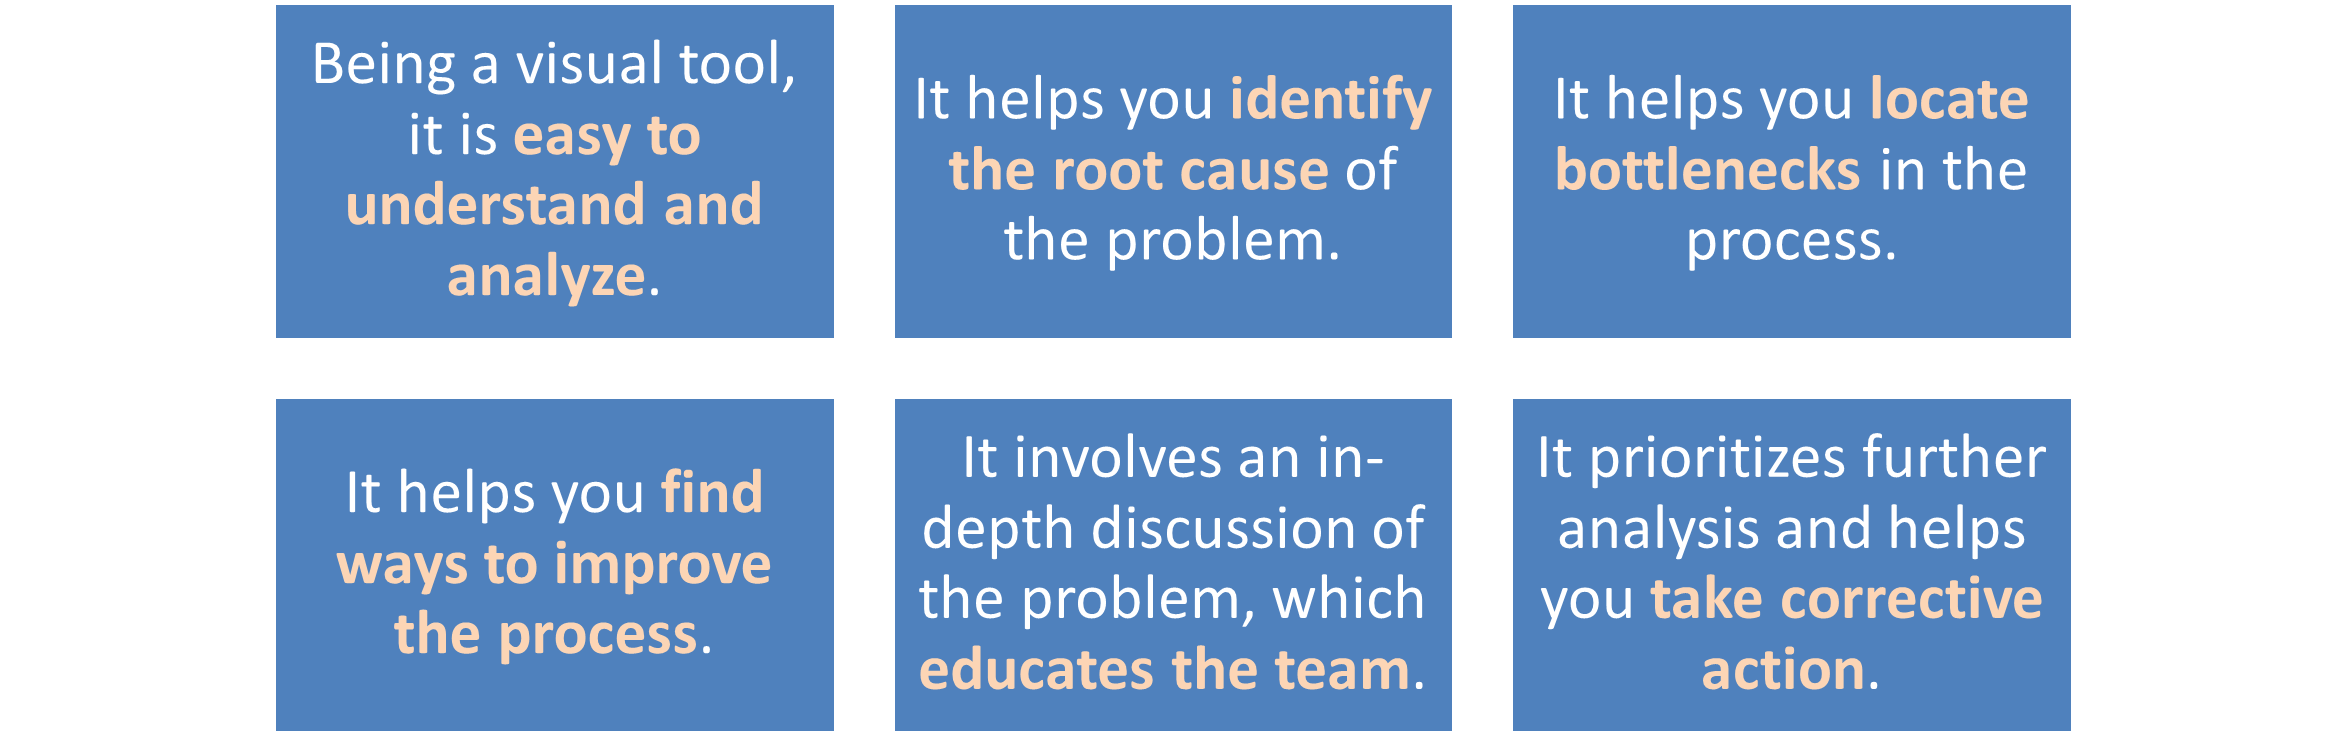
Note the benefits include the process of creating the diagram and the resulting graphic itself. When thinking from the lens of taking the PMP exam, cause and effect diagrams are a tool that has the dependency of a well-informed team and the potential to save costs (if a problem is mitigated or removed). The fishbone diagram does not work for every situation. For example, the tool will not help if opinions instead of facts are used in the discussion, nor will it help if causes with no effect are used.
What is root cause analysis
To use the Cause and Effect tool, the project manager must know what a “root cause” is in comparison to say, just a cause. The term “root” gets to the idea of the originating point. The isixsigma site provides this definition of root cause:
“The most basic reason, which if eliminated, would prevent a recurrence. The source or origin of an event.”
A cause may be eliminated, but if it is not the “root” then the problem will not be solved. With the Cause and Effect diagram, the team can bring forward multiple causes and through their knowledge of the problem, determine which cause merits more analysis as a root.
The Ishikawa diagram can be used in root cause analysis as a standalone tool, as part of an affinity diagram effort, within brainstorming sessions, and in conjunction with the “5Whys” tool. The 5 Whys Analysis complements the Fishbone diagram technique as it supports the discovery of the ultimate root cause of the issue or problem. When thinking from the lens of a PMP credential holder, it is important to know the definition of quality tools, when to use them as a standalone tool, and when to combine them for more impact.
Cause and Effect Diagrams for the PMP Exam
When a project manager is prepping for cause and effect diagram questions on the PMP exam, it critical to know more than the definition, but the uses, benefits, and best practices of the tool. Keep in mind:
- There are many root cause analysis tools for prospective PMP credential holders to consider; the cause and effect is one of the most significant.
- Cause and effect diagrams are included in the Manage and Control Quality and Manage and Monitor Risk processes.
- Cause and Effect Diagrams are also known as Fishbone, Ishikawa, Fishikawa, and Herringbone diagrams.
- Categories used on the diagram to organize causes frequently include Materials, Machine, Methods, and Measurements.
- Cause and Effect diagrams can be used in traditional or agile projects, and as a standalone tool or in conjunction with other quality tools.
Ishikawa diagram-focused PMP exam questions can address almost any industry (including but not limited to service, administration, marketing, or manufacturing) and most project approaches (Waterfall, Agile, Lean, or Six Sigma).
Upcoming PMP Certification Training – Live & Online Classes
| Name | Date | Place |


 New Horizons
 Project Management Academy
 Velopi
 Six Sigma Online
 TCM Security
 TRACOM
 Watermark Learning