 New Horizons
 Project Management Academy
 Six Sigma Online
 TCM Security
 TRACOM
 Velopi
 Watermark Learning
 Login
Login


“Overwhelmed.” That’s how most project managers feel when staring at a list of 47 identified risks, wondering which ones deserve their immediate attention. Risk is always with us, but the risk matrix transforms that chaos into clarity by mapping each risk’s probability and impact into a visual tool that instantly shows what matters most.
Within the qualitative risk assessment process, this simple grid helps project managers and teams understand how certain risks may actually derail the project versus those that are just noise. While PMI’s PMP® exam calls it the “probability and impact matrix,” most PMs know it simply as the risk matrix… and it’s about to become your best friend for both exam success and real-world project survival.
On this page:
- What is a Risk Matrix?
- When to use a Risk Matrix
- Probability and Impact Matrix (PMP)
- Risk Matrix elements
- How to create a Risk Matrix
- Risk Matrix advantages and disadvantages
- Summary

Get Your Comprehensive Guide to Risk Management
Learn how to manage risk in every project.
What is a Risk Matrix?
A risk matrix in project management is a simple tool used to evaluate and prioritize risks by plotting their likelihood of occurring against their potential impact on the project. It helps teams decide which risks need immediate attention and which can be monitored.
That kind of clarity doesn’t come automatically, though. At project kickoff, one team found themselves drowning in risk documentation, unable to separate critical threats from minor concerns. But once they applied PMI’s “risk probability and impact assessment”, evaluating how likely a risk was and how it might affect schedule, cost, quality, or performance, they had a framework to work with.
Just two weeks later, the same team could identify their top three risks within seconds and explain exactly why each one mattered.
The breakthrough came when they began plotting those probability and impact values in a risk matrix, transforming abstract risk scores into a visual tool that positioned the entire team to make better mitigation and response decisions. This simple yet powerful visualization became their compass for navigating uncertainty, turning overwhelming risk data into actionable intelligence that drove every subsequent project decision.
The transformation didn’t happen overnight, but the results spoke for themselves. What made their risk matrix so effective went beyond basic probability and impact plotting:
- Color-coded zones cut through complexity: Red meant act now, yellow required monitoring, and green could be noted without draining resources.
- Stakeholder buy-in got easier: Visual clusters made it simple to justify budget or timeline changes without wading through dense risk registers.
- Team engagement improved: Plotting risks together built shared understanding and boosted ownership of mitigation efforts.
- Trends became visible: Monthly snapshots showed shifting risk patterns, helping teams address emerging issues early.
- Resources were prioritized objectively: The matrix guided focus to high-impact risks, avoiding overreaction to familiar but low-threat concerns.
- Responses matched risk tolerance: Each quadrant pointed to the right action, from full mitigation to acceptance.

For more context on the type of risk, read this article.
When to Use a Risk Matrix
Project managers should use a risk matrix during the qualitative risk analysis phase, which is part of the broader risk management knowledge area. It’s most effective after identifying risks and before selecting mitigation strategies. This tool helps assess and prioritize risks in project management based on their likelihood and impact.
In practice, a risk matrix should be used:
- During project planning to identify and evaluate threats early.
- When introducing new processes or initiatives to anticipate potential challenges.
- When changes are made to teams, systems, or workflows that could introduce new risks.
- When new risk information surfaces and previously assessed risks need to be reevaluated.
- When required for compliance audits, such as those under ISO 27001 or SOC 2 frameworks.
As part of the qualitative risk analysis process, each risk’s probability and impact are plotted on the matrix. This visual framework guides project teams in determining which risks need immediate attention and which can be monitored over time.
Probability and Impact Matrix (PMP)
In project management, the probability and impact matrix, also known as a risk matrix, is a visual tool used during the qualitative risk analysis process to assess and prioritize identified risks. It’s a key concept in the PMP Certification framework and aligns with PMI’s recommended approach to evaluating risks based on two key dimensions:
- Probability: The likelihood that a risk event will occur during the project.
- Impact: The extent to which the risk event would affect the project’s objectives (schedule, cost, scope, or quality) if it does occur.
These two factors are combined to help teams determine the severity of each risk and decide which ones require mitigation, monitoring, or acceptance.
How It Works:
- Risk Identification
Risks are first identified through brainstorming, expert judgment, and other techniques. - Define Scales for Probability and Impact
Each project should define its own probability (e.g., very low to very high) and impact scales (e.g., negligible to severe) early in the project. These scales are often numerical (1–5) or descriptive and should remain consistent throughout the project. - Assess and Score Risks
For each risk, assess both probability and impact. For example, a risk with high probability and high impact would score higher than one with low probability and low impact. - Plot on the Matrix
Risks are plotted on a grid with probability on one axis and impact on the other. This creates a visual map of risk severity, usually color-coded:- Red (High): Immediate attention and mitigation required
- Yellow (Moderate): Monitor and develop contingency plans
- Green (Low): Accept or track with minimal resources
- Use for Prioritization
The matrix helps the project team prioritize risks and decide where to allocate time, budget, and resources. It prevents teams from overreacting to low-severity issues or overlooking high-impact, low-probability threats.
Context for PMP Certification Students:
The PMBOK® Guide emphasizes the importance of tailoring probability and impact definitions to the specific project. These definitions and scoring thresholds should be documented early as part of the risk management plan. Data quality is crucial—accurate, well-sourced inputs lead to better decisions and stronger project outcomes.
Ultimately, the probability and impact matrix is a core PMP risk analysis tool that bridges subjective judgment with structured decision-making, helping project managers act proactively rather than reactively.

Risk Matrix Elements
A risk matrix, also known as a probability and impact matrix, is a visual tool used to categorize and prioritize project risks based on two primary dimensions:
- Probability (or Likelihood): How likely it is that a risk event will occur
- Impact (or Severity): The extent of damage or disruption if the risk does occur
These two axes form the foundation of the matrix, with risks plotted accordingly to determine their overall risk score and significance.
Key Structural Elements
| Element | Description |
|---|---|
| X-Axis: Probability | Represents how likely a risk is to occur. Also labeled as likelihood or likelihood of occurrence. |
| Common Probability Scales | – Low, Medium, High – Unlikely, Possible, Likely – Highly Improbable to Highly Probable (5-point scale) |
| Y-Axis: Impact | Represents how severely the project will be affected if the risk occurs. Also labeled as impact, consequence, or severity. |
| Common Impact Scales | – Low, Medium, High – Minor, Moderate, Major – Insignificant to Critical (5-point scale) |
| Risk Scoring Indicators | Risk levels are typically color-coded: – Red = High Risk (needs urgent mitigation) – Yellow = Medium Risk (monitor closely) – Green = Low Risk (acknowledge, minimal action) |
| Matrix Size | Common sizes include 3×3, 4×4, or 5×5 grids. Both axes should have the same number of intervals to support valid comparisons and calculations. |
| Customization by Organization | Many organizations develop templates specific to their project types or industry standards (e.g., construction, healthcare, IT). These may include tailored definitions for probability and impact, consistent with their risk tolerance. |
| Clarity vs. Complexity | Larger grids (e.g., 10×10 or 100-point scales) offer granularity but do not necessarily improve accuracy and can complicate analysis. Simpler matrices (3×3 or 5×5) are often more effective for decision-making. |
How the Matrix Supports Risk Assessment
Once risks are identified, teams assign each one a probability rating and an impact rating, then place it within the matrix. This visual placement:
- Highlights high-priority risks (high likelihood + high impact)
- Flags low-priority risks (low likelihood + low impact)
- Helps allocate resources and mitigation efforts appropriately
This structure supports qualitative risk analysis within the PMP framework and is a required component of many risk management plans aligned with PMI’s PMBOK® Guide.
Studying for the PMP Exam?
How to Create a Risk Assessment Matrix
A risk matrix is a visual decision-making tool that helps project teams assess, prioritize, and communicate risks by combining likelihood (probability) and impact (severity). While some companies may have required tools or templates, most project managers can build an effective matrix using spreadsheet software like Microsoft Excel or Google Sheets.
According to PMI’s A Guide to the Project Management Body of Knowledge (PMBOK® Guide), Sixth Edition (p. 423), building a risk matrix involves four core steps:
- Risk Identification
- Risk Analysis
- Assessing Risk Impact
- and Risk Prioritization.
Step 1: Identify Risks
Start by identifying potential operational risks related to your project’s scope, schedule, budget, goals, and resources. This is typically done through brainstorming sessions, document reviews, or interviews with stakeholders. Each identified risk should be added to a risk register for tracking.
Step 2: Define Risk Criteria and Analyze Risks
Before plotting anything, the team must define the scales for probability and impact. These should be tailored to the specific project and consistently applied throughout the risk management process. Common scale formats include:
- Probability: Rare, Unlikely, Possible, Likely, Almost Certain
- Impact: Insignificant, Minor, Moderate, Major, Critical
Assign a numerical value to each level (e.g., 1–5) to enable scoring. Then, for each risk, evaluate its probability of occurring and its potential consequences based on these predefined criteria. Expert judgment, interviews, and past project data can help validate each rating.
Step 3: Assess Risk Impact Level
Using the project’s agreed-upon impact scale, determine how much each risk could disrupt key objectives—such as cost, quality, or timeline—if it materializes. This assessment can be refined by involving stakeholders with experience in similar projects or workstreams.
Step 4: Prioritize and Plot Risks on the Matrix
Once each risk has a probability and impact score, plot it on the risk matrix. It’s typically a 3×3, 4×4, or 5×5 risk matrix grid, with probability on one axis and impact on the other. The intersection of these two values shows the risk score and its relative priority.
To enhance clarity:
- Use color-coded zones:
- Green = Low risk (monitor only)
- Yellow = Medium risk (watch closely or prepare contingencies)
- Red = High risk (requires immediate action or mitigation)
- Always pair text labels with colors to avoid miscommunication due to color blindness or cultural differences. Use terms like “Low,” “Medium,” and “High” alongside color coding to reinforce clarity.
Final Output: Visual Risk Map
The matrix becomes a heatmap of risk severity, helping the project manager and team quickly see which risks need urgent attention and which can be tracked or deferred. This tool supports faster, more informed decisions during planning and throughout project execution.
Using the Risk Matrix as an Input for Risk Response
With a clear visual of all risks plotted, the project team can begin grouping risks by severity. The matrix serves as a key input to determine which risks require mitigation strategies, contingency planning, or simple monitoring. High-priority risks can be escalated to stakeholders early, improving preparedness and response.
Ongoing Use: Monitor and Update
A risk matrix is not a one-time tool. As the project evolves, new risks may emerge, and existing ones may change in probability or impact. Reassess and update the matrix regularly—especially after major changes, milestone reviews, or when new risk data becomes available.
Drawbacks and Benefits of a Risk Matrix
The risk matrix tool fits within risk assessment and is a simple and quantitative way of evaluating project risk. It evaluates risks based on their probability of occurrence and the potential impact on the project.
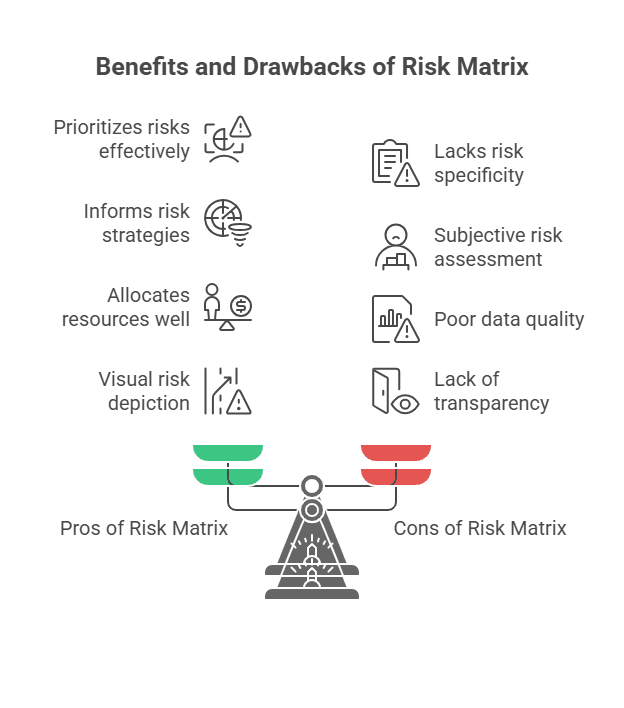
Pros of Risk Matrix
When used correctly, including with verified and high-quality data, the risk matrix helps the project manager with these critical tasks and decisions:
- prioritizing all risks to gain an understanding of the level of severity
- informing of more accurate risk management strategies
- providing low-cost means to conduct risk analysis
- allocating appropriate levels of resources for risk
- increasing or decreasing the impact of a risk that does occur
A well-constructed risk matrix is an advantage to the project team in these ways:
- a visual depiction of risk across the project, conveying the significance
- a means to help the team understand risk across the project
- identification of areas for which risk is highest
- information to help better allocate resources for risk
The well-constructed risk matrix is a tool for helping the project manager and team better achieve the project goals as planned.
Cons of Risk Matrix
Project managers need to know the risks and advantages of the risk matrix. One inherent disadvantage of the probability and impact risk assessment matrices is the potential exclusion of qualitative risk characteristics and their potential impact. Project managers should use qualitative and quantitative data whenever possible to increase objectivity and accuracy.
For the project, potential disadvantages of the risk matrix tool include:
- Matrix categories lack the needed level of specificity to enable accurate risk ranking
- Poor quality data used for values results in inaccurate probability and impact scores
- Failure to account for the timing of the risk occurring in terms of the potential impact of it
- Overall subjectivity of risk assessment leading to unreliable values used to calculate risk
If the project manager fails to communicate the risk matrix results to the team and stakeholders, the team can have several disadvantages. The lack of transparency conveys a lack of trust among the project manager and team, with long-lasting negative impacts during the project. A failure to share the risk matrix with the team creates a lost opportunity for the team to have information to guide their responsibilities within the project better.
Summary
Project managers use the risk matrix tool as part of the process of performing qualitative risk analysis. The risk matrix tool, known as the “risk matrix PMP” or “probability and impact matrix PMP,” is the visual representation of project risk, allowing for a better understanding of risk across the project. Project managers use the risk matrix tool to see the “danger level” of risk for the project. Using a well-constructed risk matrix, the project manager and project team can conduct more effective risk mitigation and response aligned to the significance of each risk.
Upcoming PMP Certification Training – Live & Online Classes
| Name | Date | Place |


 New Horizons
 Project Management Academy
 Velopi
 Six Sigma Online
 TCM Security
 TRACOM
 Watermark Learning