
 New Horizons
 Project Management Academy
 Six Sigma Online
 TCM Security
 TRACOM
 Velopi
 Watermark Learning
 Login
Login


Data is the lifeblood of modern project management, but it’s also its greatest curse. Project Management Professional® (PMP) holders collect requirements, gather feedback, and accumulate insights at breakneck speed—only to find themselves staring at a chaotic mess of information that seems completely disconnected from actual project execution.
Sarah, a seasoned PMP at a Fortune 500 company, learned this lesson during a particularly brutal ERP implementation. After collecting input from twelve different stakeholder groups, she found herself with 200+ sticky notes covering her office wall, each representing a different concern, requirement, or suggestion. The deadline was approaching, her team was overwhelmed, and executive leadership was demanding clear priorities. That’s when she discovered the affinity diagram—a surprisingly elegant solution hiding in plain sight.
The affinity diagram isn’t just another planning tool; it’s a collaborative problem-solving technique that transforms information overload into actionable insights. More importantly, it turns the frustrating process of data organization into a team-building exercise that actually strengthens stakeholder buy-in and project alignment.
On this page:

Free Download:
The Ultimate Data Quality Guide
Learn about the 7 data quality
tools every project manager
should know!
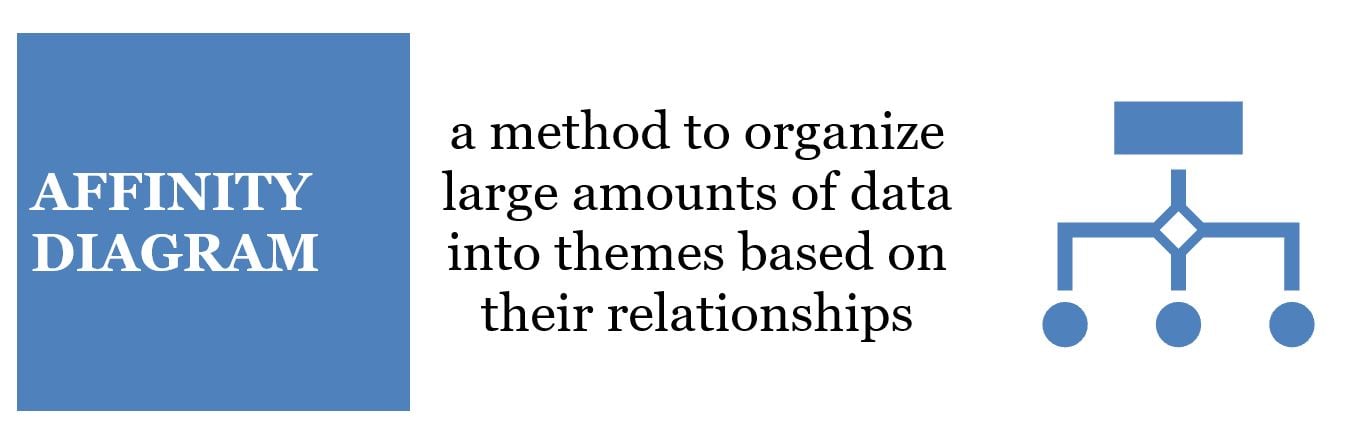
What is an Affinity Diagram
When you’re faced with a flood of ideas—think brainstorms, stakeholder input, or research findings—the affinity diagram is what keeps you from drowning in it all. It’s a tool that helps project managers bring order to the chaos by grouping related ideas into meaningful categories.
Defined in the PMBOK® Guide, Sixth Edition (page 144), the affinity diagram is one of the Seven Management and Planning Tools. If you’re preparing for the PMP® exam, it’s one of those tools you’re expected to know cold.
At its core, an affinity diagram helps you:
- Group related ideas, tasks, or data points that naturally fit together
- Organize unstructured input into themes or categories
- Reveal new patterns or connections that might otherwise get missed
It’s especially useful after brainstorming sessions or data-gathering activities—anytime you end up with a wall full of notes and no obvious structure. Rather than forcing ideas into predefined buckets, the affinity method lets the relationships emerge organically, which often leads to clearer insights and smarter decisions.
If you’re serious about rounding out your project management skillset—or just want to survive the PMP exam with your sanity intact—learning how and when to use an affinity diagram is a must. It’s a simple concept, but in the right hands, it can turn information overload into actual strategy.
Examples of Affinity Diagrams
Whether you’re collaborating virtually or working in person with a whiteboard and sticky notes, the affinity diagram is a flexible tool that fits any project environment. It helps teams bring structure to scattered ideas—no matter where or how they work.
Remember, the goal of an affinity diagram is to create clarity during the thought process and uncover new patterns of thinking. With that in mind, which of the following diagrams best represents an affinity diagram?
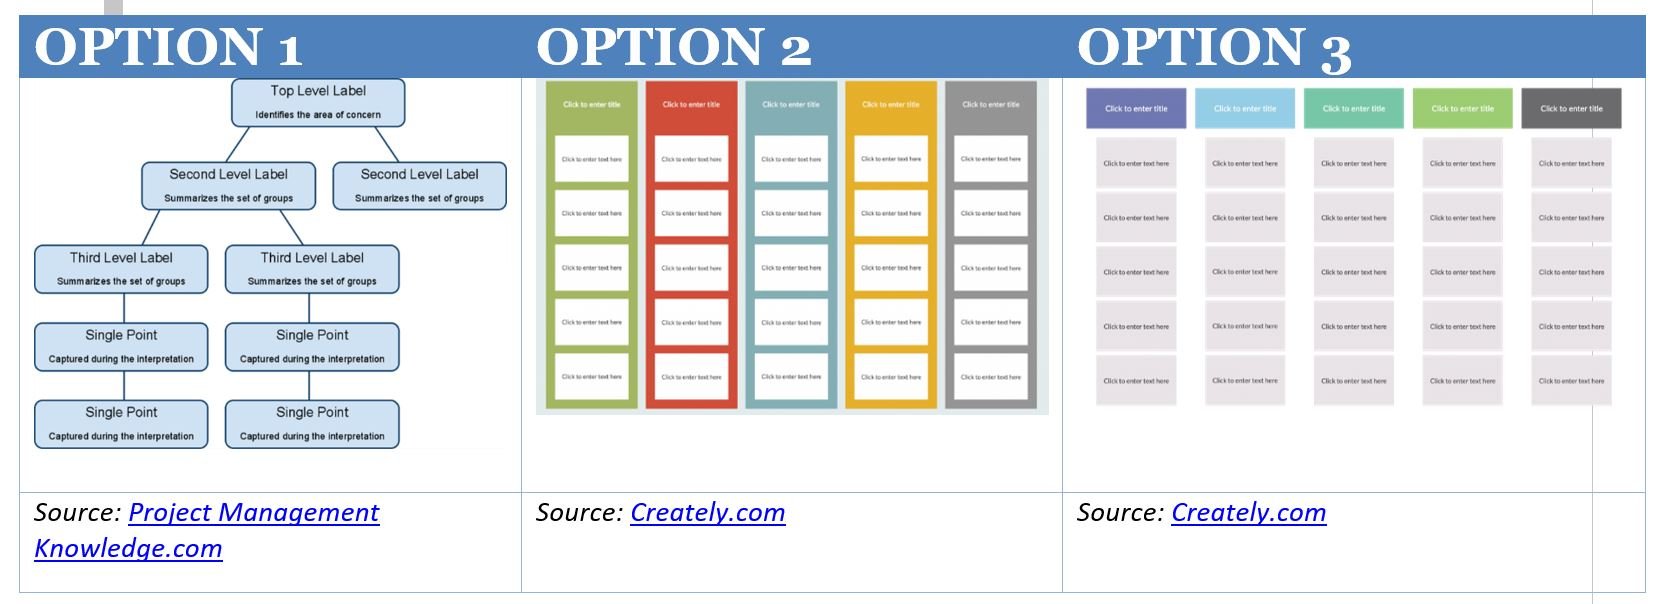
Each of the options shown illustrates a way to organize data around themes or relationships. For a clear example of an actual affinity diagram, SixSigma.com offers this visual:
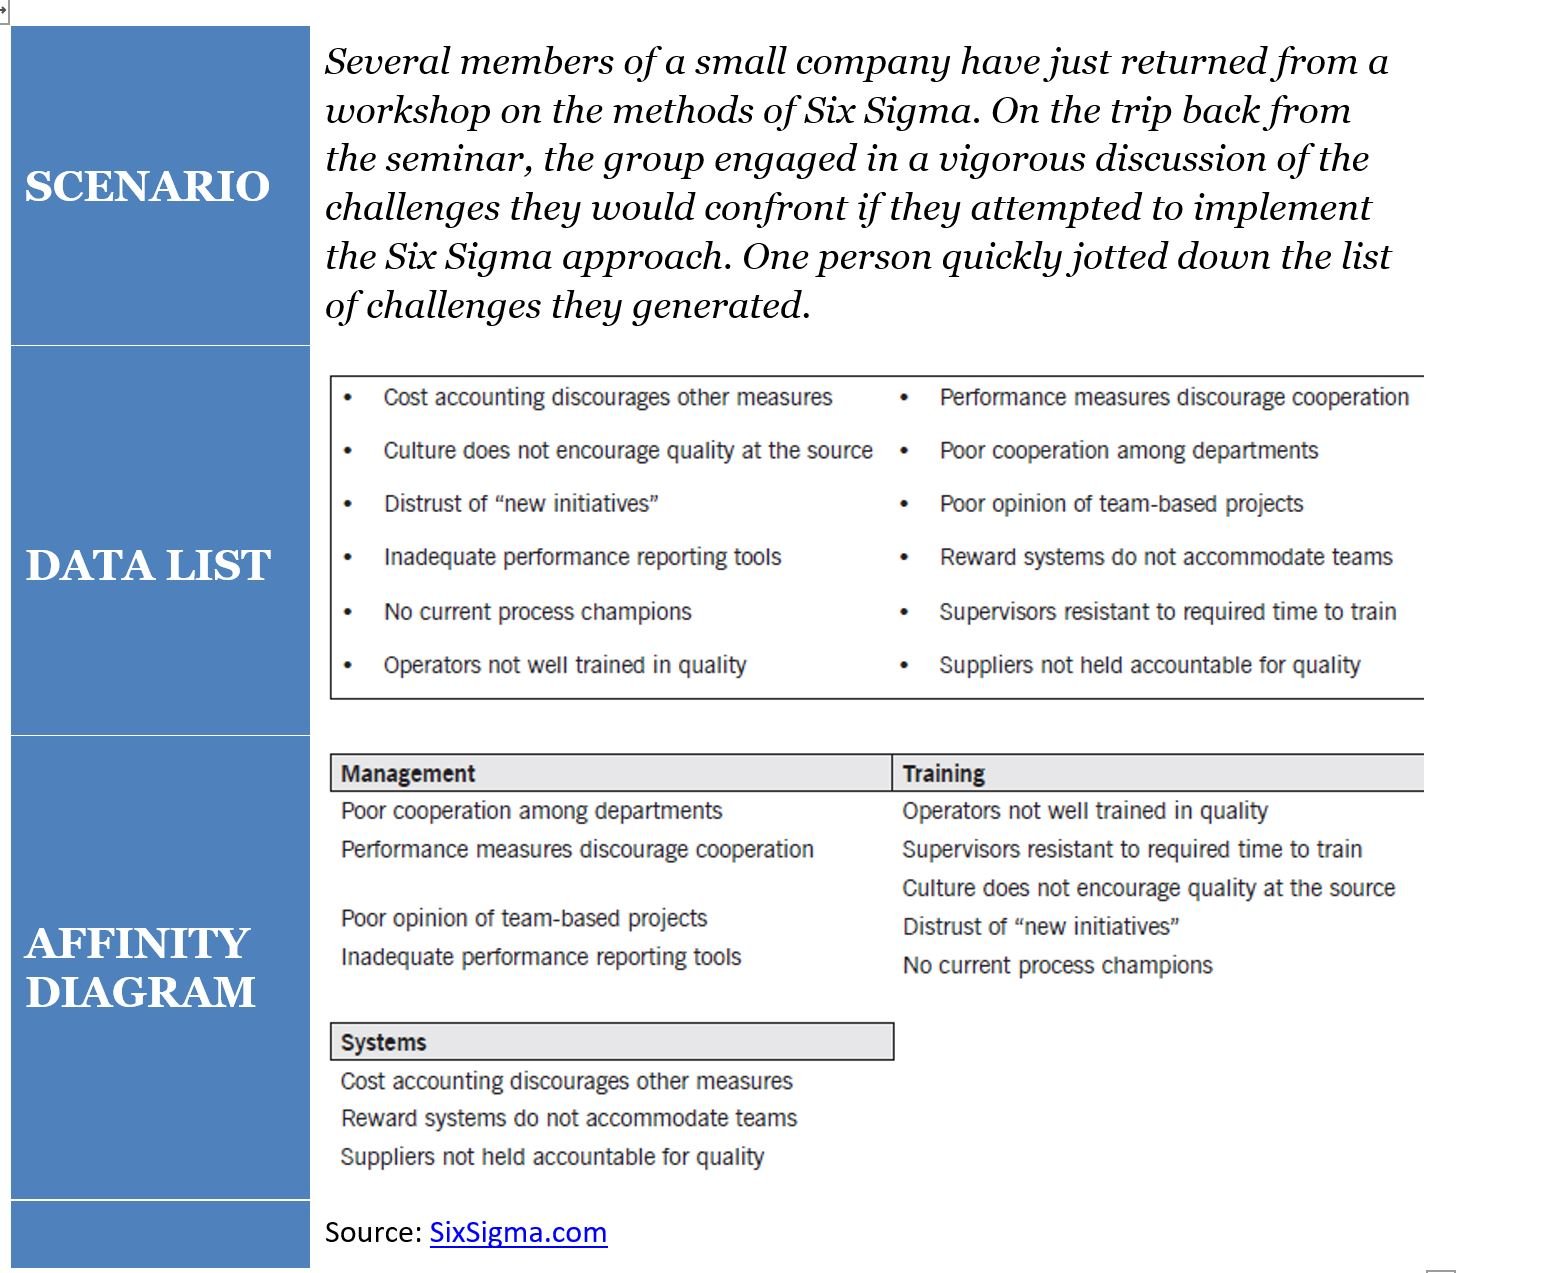
Each example may have looked a little different, but they all had the same purpose—making sense of scattered data. In project environments, you don’t need fancy software to use an affinity diagram. What you do need is the ability to gather input, spot patterns, and organize ideas in a way that helps the team uncover insights or opportunities. That’s the kind of thinking the PMP exam expects you to understand.
Affinity Diagrams in Context of the PMP Exam
The Seven Management and Planning Tools are analytical techniques that help project managers organize information, solve problems, and support decision-making—especially when dealing with complex or unstructured data. PMP® exam candidates should understand each tool’s purpose, when to use it, and how it fits into the broader planning process.
Here are the Seven Management and Planning Tools:
- Affinity Diagram (KJ Method)
Organizes large amounts of unstructured information by grouping related ideas based on natural relationships. Useful during brainstorming sessions or when dealing with chaotic, complex data. - Interrelationship Diagram
Maps out cause-and-effect relationships among multiple factors in a complex situation. Helps identify root causes and understand how elements influence each other. - Tree Diagram
Breaks down broad goals into detailed levels of tasks or actions. Ideal for clarifying steps needed to achieve objectives by moving from general to specific. - Prioritization Matrix
Compares options using weighted criteria to support decision-making. Often used for ROI analysis, time management, or narrowing choices based on impact and feasibility. - Matrix Diagram
Shows relationships between two or more sets of data. It helps identify the strength of relationships and interactions among factors or roles. Can take various shapes (L, T, Y, X, C, R) depending on the structure of comparison. - Process Decision Program Chart (PDPC)
Extends a tree diagram to identify potential risks in lower-level tasks and outlines countermeasures. Useful for contingency planning and preventing failure points. - Arrow Diagram (Activity Network Diagram)
Visualizes the sequence and dependencies of tasks in a project. Used to identify the critical path and manage complex scheduling requirements, especially when some tasks must occur in parallel.
For both the PMP exam and real-world projects, it’s essential to understand all Seven Management and Planning Tools—what they are, how they work, and when to use them. These tools aren’t just theory; they show up in exam questions and support practical planning, analysis, and decision-making in complex project environments.
Studying for the PMP Exam?
When the PMP holder uses an Affinity Diagram
Affinity diagrams—also known as the K-J method—are used to turn information overload into clarity. They help project teams group scattered ideas into meaningful categories so insights can guide planning and decision-making.
Here’s a typical example: A project manager is facilitating a risk identification session. Each team member writes down potential risks—one per sticky note. Without discussion, they silently group similar risks together. Once all risks are clustered, the team names each group based on common themes. It’s quiet, focused, and surprisingly effective. What starts as a messy wall of notes becomes a clear snapshot of the project’s risk landscape.
PMP® credential holders often turn to this tool when:
- The data is overwhelming or disorganized
- Diverse perspectives need to be aligned
- The team is stuck and needs a fresh way to spot connections
The process itself can be just as valuable as the result. It encourages equal participation, minimizes groupthink, and surfaces patterns that might otherwise go unnoticed. Whether used for risk planning, stakeholder analysis, or brainstorming solutions, affinity diagrams bring structure to complexity—something every PMP needs in their toolkit.
Project managers and PMP credential holders can use the affinity diagram process and resulting graphic to:
- Find creative solutions to difficult problems by involving people from diverse fields
- Sort through large volumes of confusing data and in a logical, easy-to-understand manner
- Generate discussions leading to innovation/ effective solutions
- Present analysis in an easy-to-understand manner
One reason affinity diagrams are so useful is that they can be used in almost any project setting with large amounts of data that need to be organized. The process of creating the diagram provides insights, as does the final diagram.
How to create an Affinity Diagram
Whether using Google JamBoard online or Post-Its® in a conference room, a project manager can follow key steps to guide the team through creating an affinity diagram. Here is a ten-step instruction list from Interaction-Design.com that guides the project manager through the process:
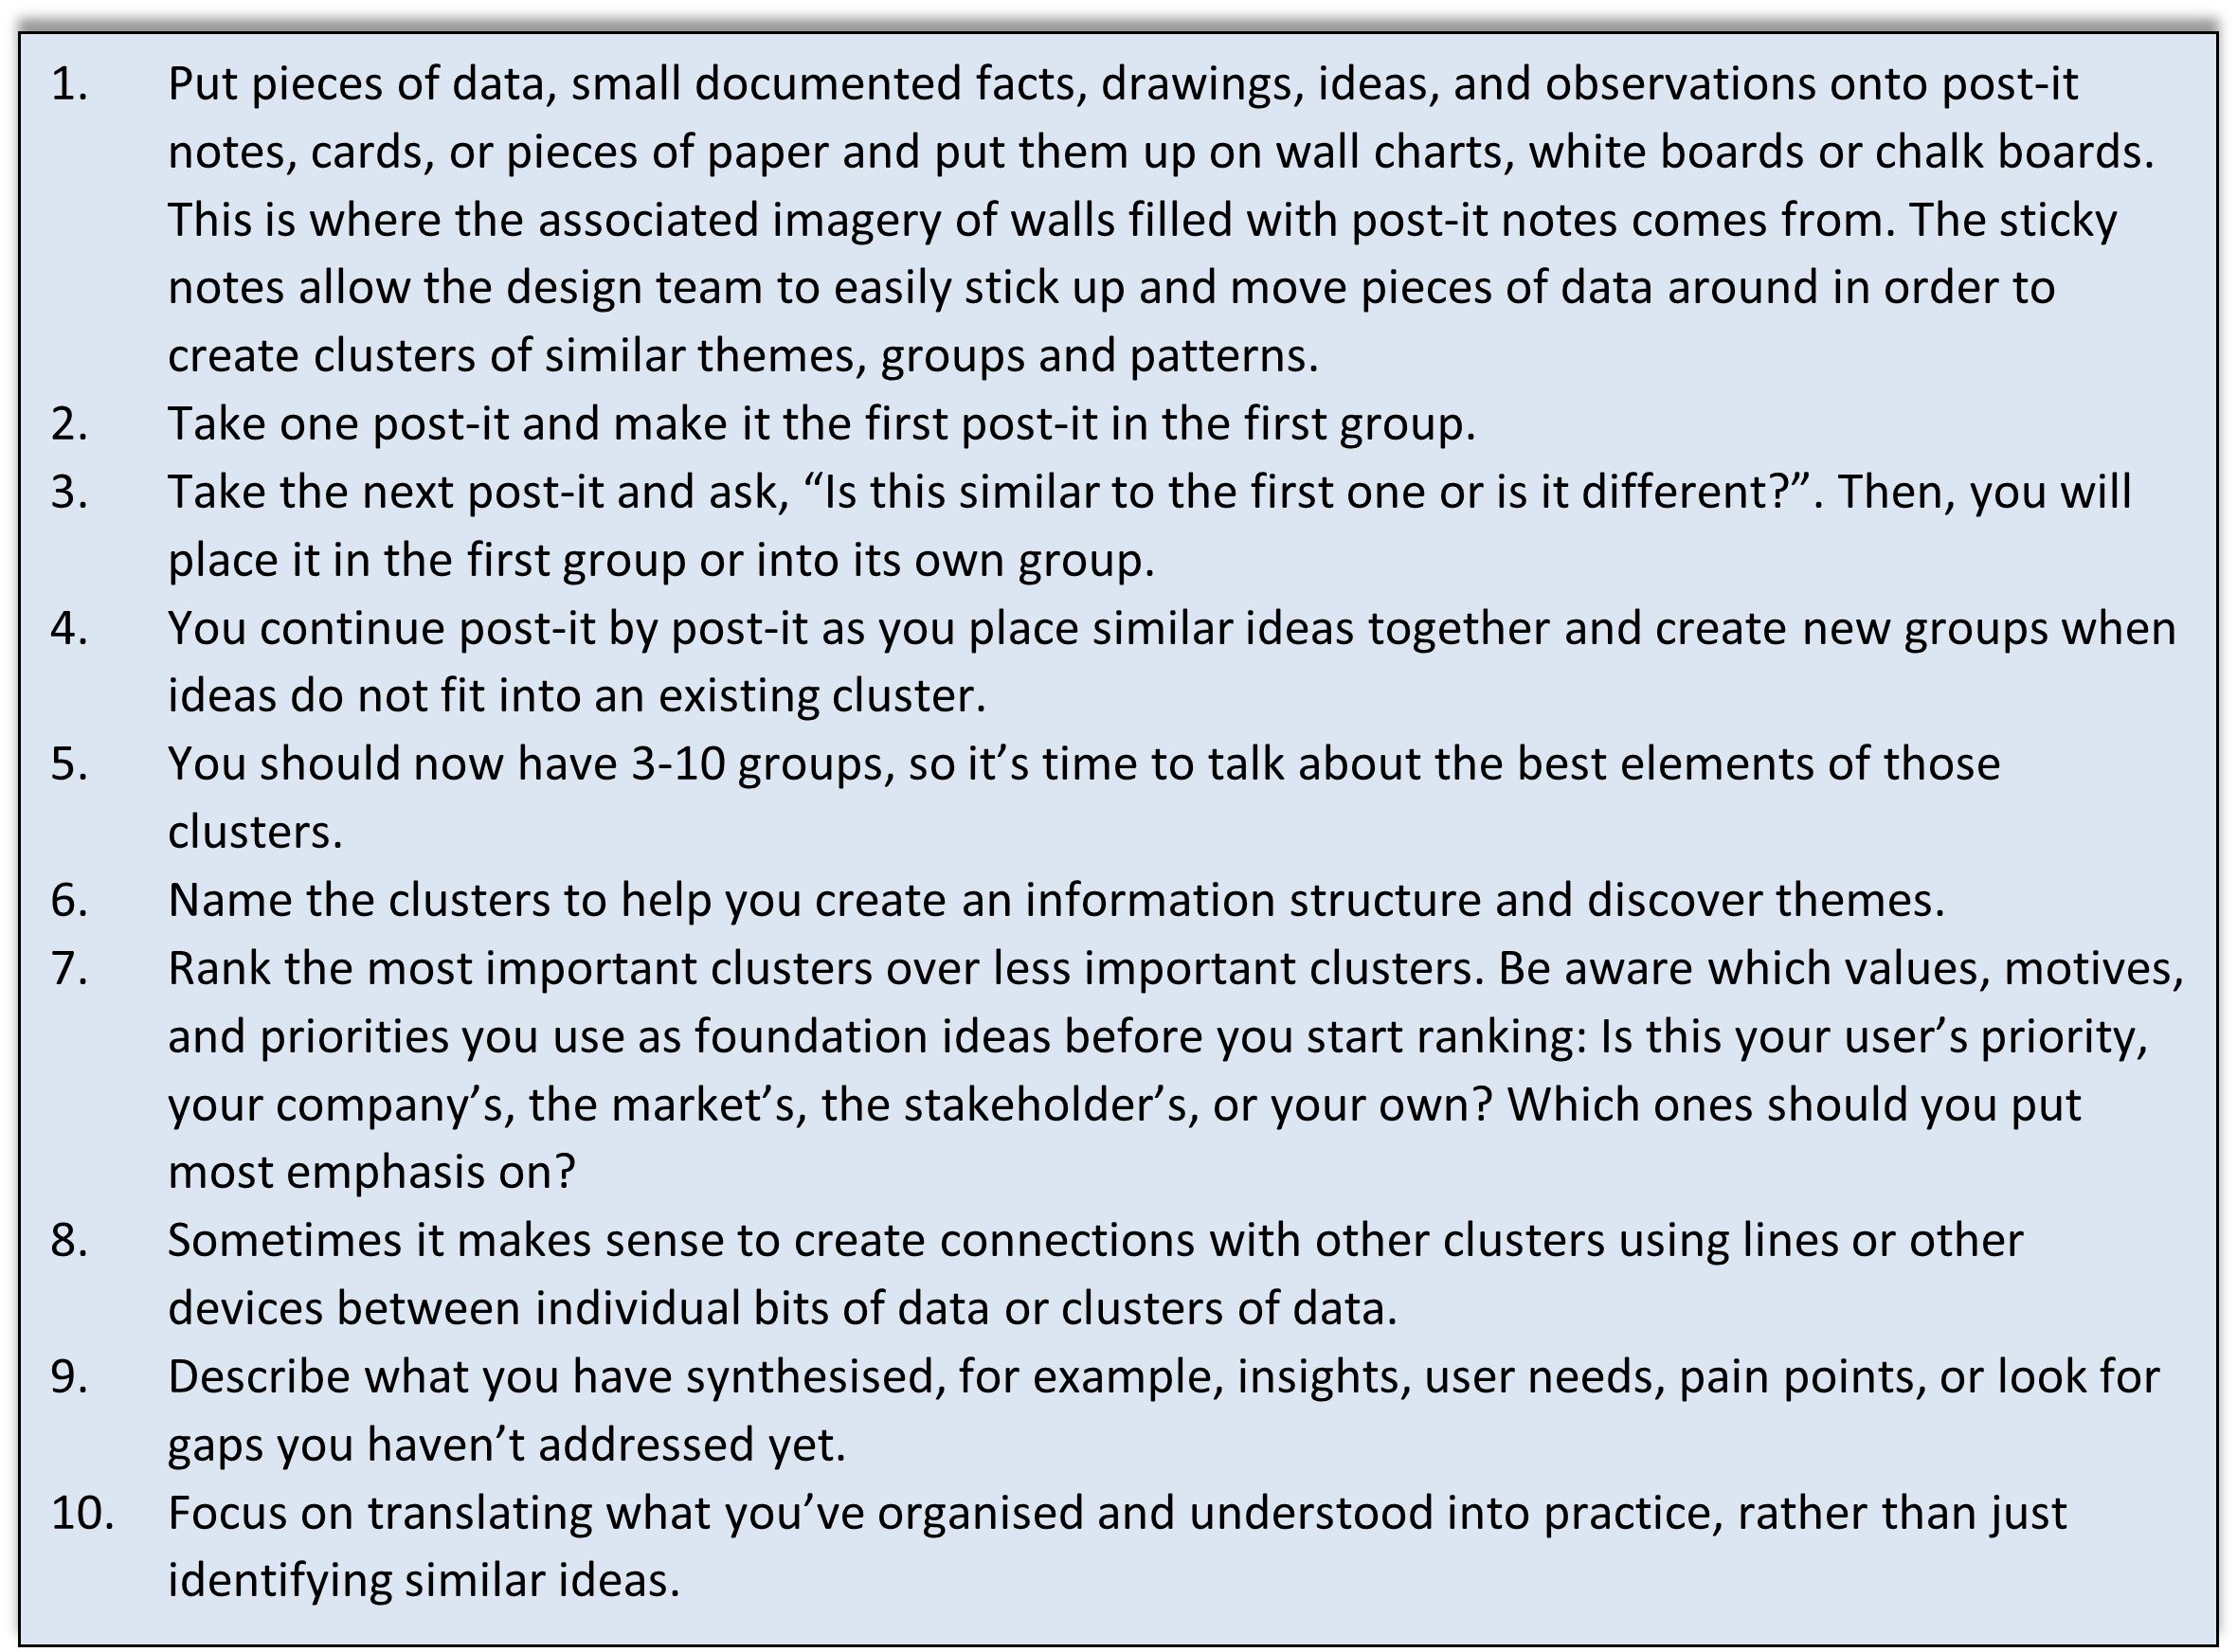
Information should be organized by participants with different backgrounds so that the connection points within the data bubble to the surface organically. Those outside of
Affinity Diagrams
In addition to organizing project-related data to discover powerful themes, the affinity diagram is “frequently used in contextual inquiry as a way to organize notes and insights from field interviews” and for “organizing other freeform comments, such as open-ended survey responses, support call logs, or other qualitative data.” Due to its many uses, project managers with or without the PMP should leverage the affinity diagram.
Upcoming PMP Certification Training – Live & Online Classes
| Name | Date | Place |


 New Horizons
 Project Management Academy
 Velopi
 Six Sigma Online
 TCM Security
 TRACOM
 Watermark Learning