
 New Horizons
 Project Management Academy
 Six Sigma Online
 TCM Security
 TRACOM
 Velopi
 Watermark Learning
 Login
Login



Key Takeaways
- KPI vs. Metric: not every number tracked on a dashboard qualifies as a KPI
- A Defensible Shortlist: 33 KPIs cover the field, only 7 belong on a status report
- Calibrated Targets: PMI anchors a few, your baseline sets most, some don’t exist
- The Rebaseline Test: a documented standard separates a real rebaseline from a cover story
- Metrics Get Gamed: reward a KPI, and people optimize it, not necessarily improve it
Which of your project’s numbers would survive your VP asking how you know that’s a good number? Most project managers can rattle off a dozen KPIs without much trouble. Far fewer can say, on the spot, which ones have a real target behind them and which ones are only something the dashboard happened to track.
That gap matters more than it looks, and it’s exactly what separates project managers who can defend a report from ones who get asked follow-up questions they can’t answer. Some project management KPIs carry a real PMI-anchored formula and benchmark. Most only mean something against your own project’s history. And a few of the numbers making the rounds in vendor blog posts have no defensible source at all.
This guide sorts all three out, starting with the difference between a KPI and another number on a dashboard, and closing with the two conversations that number eventually forces: justifying a baseline change and catching a KPI that’s being gamed.
KPI vs. Metric: What Makes a KPI a KPI
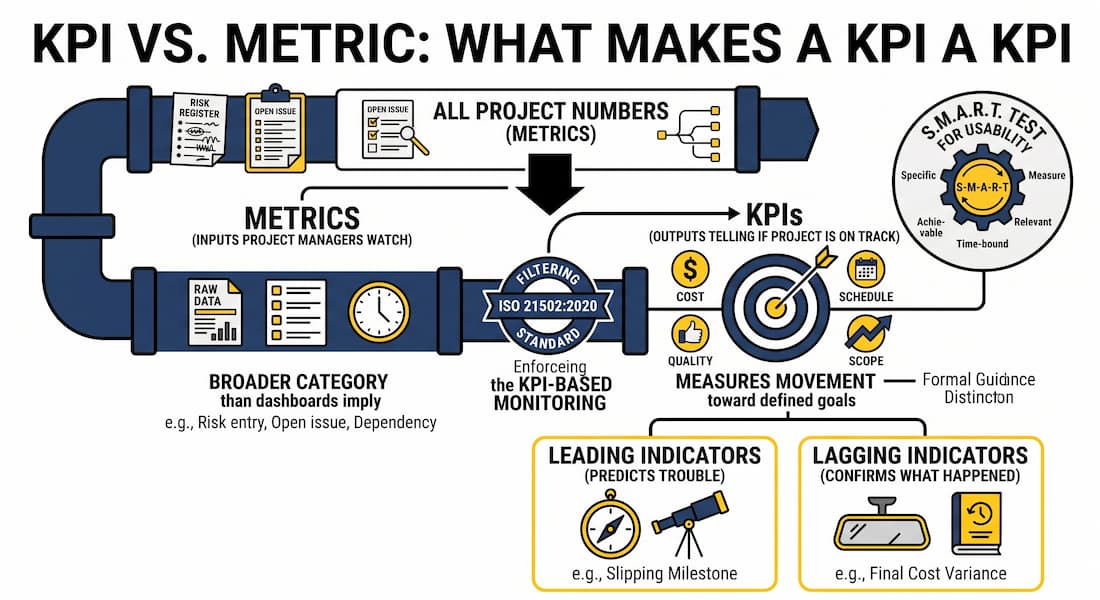
A key performance indicator measures whether the project is moving toward its defined goals: cost, schedule, quality, or scope. That’s a narrower category than most dashboards imply. A risk register entry, an open issue, or a dependency waiting on another team isn’t a KPI solely because someone is tracking it. ISO 21502:2020, the current international guidance standard for project management, calls for exactly this kind of KPI-based monitoring, so the distinction is formal guidance rather than a house preference.
Those are inputs a project manager watches. A KPI is the output: the number that tells you, without opening the risk log, whether the project is on track.
The same number often travels under two names. One source calls it Cost Variance (CV, covered in full later in this guide), another calls it deviation from planned budget, and a status report that switches between them mid-document reads as if it’s tracking two different systems instead of one. Naming it consistently matters more than which term you pick.
The S.M.A.R.T. criteria, specific, measurable, achievable, relevant, and time-bound, are the standard test for whether a candidate KPI is usable. A number that can’t be measured consistently, or that nobody can act on, doesn’t clear the bar even if it’s genuinely related to project performance.
That same usability test is also what separates the two kinds of KPI a scorecard needs. A leading indicator predicts trouble ahead of time, like a slipping milestone. A lagging indicator confirms what already happened, like final cost variance. Both belong on a well-built scorecard, and the mistake worth avoiding is treating every number that’s easy to pull from your project management software as if it earned a place there because it’s available.
33 Types of KPIs in Project Management
Every project tracks dozens of numbers, but only some of them qualify as KPIs by the definition above. The following 33 span the five categories that show up across most project management software: schedule, cost, quality, resource, and stakeholder or risk. Each one carries a leading or lagging tag: leading means it predicts trouble ahead of time, lagging means it confirms what already happened. Within each category, the leading indicators are listed first, since those are the ones worth checking before a problem shows up in the lagging numbers.
| Category | KPI | What It Measures | Leading or Lagging |
|---|---|---|---|
| Schedule | Critical Path Slippage | Movement in the longest dependent task chain | Leading |
| Schedule | Schedule Variance (SV) | Difference between earned value and planned value | Lagging |
| Schedule | Schedule Performance Index (SPI) | Earned value divided by planned value, as a ratio | Lagging |
| Schedule | Milestone Completion Rate | Share of milestones hit on their planned date | Lagging |
| Schedule | Percentage of Milestones Missed | Share of milestones that slipped past their date | Lagging |
| Schedule | Planned vs. Actual Finish Variance | Gap between the baseline finish date and the current forecast | Lagging |
| Cost | Estimate at Completion (EAC) | Forecasted total cost at project close | Leading |
| Cost | Estimate to Complete (ETC) | Forecasted cost of the remaining work | Leading |
| Cost | To-Complete Performance Index (TCPI) | Cost efficiency required on remaining work to hit budget | Leading |
| Cost | Planned Value vs. Actual Cost | Budgeted burn rate against real spend | Leading |
| Cost | Cost Variance (CV) | Earned value minus actual cost | Lagging |
| Cost | Cost Performance Index (CPI) | Earned value divided by actual cost, as a ratio | Lagging |
| Cost | Cost of Quality | Spend on prevention, appraisal, and rework combined | Lagging |
| Quality | Number of Open Quality Issues | Count of unresolved defects or non-conformances | Leading |
| Quality | Defect Rate | Share of deliverables failing acceptance criteria | Lagging |
| Quality | Rework Rate | Share of completed work redone before acceptance | Lagging |
| Quality | Test Pass Rate | Share of test cases passing on first attempt | Lagging |
| Quality | Deliverable Acceptance Rate | Share of deliverables accepted without revision | Lagging |
| Quality | Customer Satisfaction Score | Stakeholder-rated quality of delivered work | Lagging |
| Resource | Resource Utilization Rate | Share of available capacity billed or assigned | Leading |
| Resource | Overtime Rate | Share of hours worked beyond standard capacity | Leading |
| Resource | Team Velocity | Work completed per iteration, in agile delivery | Leading |
| Resource | Bench Time | Hours resources sit unassigned between tasks | Leading |
| Resource | Cross-Project Resource Conflict Rate | Frequency of the same resource double-booked across projects | Leading |
| Resource | Planned vs. Actual Hours | Budgeted labor hours against hours logged | Lagging |
| Resource | Task Completion Rate | Share of assigned tasks closed on schedule | Lagging |
| Stakeholder/Risk | Scope Change Request Rate | Volume of change requests submitted per period | Leading |
| Stakeholder/Risk | Number of Open Risks | Count of identified risks not yet closed or mitigated | Leading |
| Stakeholder/Risk | Risk Exposure Value | Probability-weighted cost of open risks | Leading |
| Stakeholder/Risk | Approved Change Request Percentage | Share of change requests formally approved versus absorbed informally | Lagging |
| Stakeholder/Risk | Stakeholder Satisfaction Score | Stakeholder-rated confidence in the project’s direction | Lagging |
| Stakeholder/Risk | Issue Resolution Time | Average time to close a logged issue | Lagging |
| Stakeholder/Risk | Sponsor Engagement Score | Frequency and quality of sponsor participation in reviews | Lagging |
That’s the full field, and it’s also the problem. Nobody reports 33 numbers to a steering committee. The next section narrows this list to the 7 that belong on a status report, and why.
7 KPI Examples Worth Including on Your Status Report
Most of the status-report advice online tells you to pick a few KPIs that matter and stops there. Here’s what that looks like for a project manager two to five years into the role, reporting up to leadership who don’t want the full 33-item menu.
Schedule Performance Index and Cost Performance Index earn the top two slots because they’re the only two numbers on this list with a PMI-anchored formula behind them, which means nobody in the room can argue about what they mean, only about what to do next. Estimate at Completion follows immediately after, because a CPI on its own tells leadership you’re over or under budget; EAC tells them by how much, in dollars, by the end.
Percentage of Milestones Missed belongs on the list because it’s the number a sponsor remembers between meetings, more than any ratio. Number of Open Risks matters for a related reason: tracked against your project’s own risk-exposure threshold, and backed by a risk report built to survive scrutiny, it shows leadership the count directly, without asking them to trust your judgment. Approved Change Request Percentage answers the question leadership asks right before a baseline conversation, which the next few sections cover directly: how much of what changed was formally approved, versus absorbed informally in the gap between gold plating and scope creep.
The seventh slot, Stakeholder Satisfaction Score, is the one number on this list that doesn’t come from cost or schedule math, and it’s there because a project can hit every other target and still fail if the people receiving the work don’t trust the process that produced it. That trust tracks closely with what an engaged executive sponsor does day to day: keeping resources dedicated and priorities aligned across departments long before a status report ever gets read. Two of those seven, Schedule Performance Index and Cost Performance Index, are also the two numbers worth understanding at the formula level, since a leadership question about either one usually turns into a question about how it’s calculated.
Earned Value Metrics: Avoiding Double-Counted Data
The earned value metrics on the list above, Cost Variance, Cost Performance Index, Schedule Variance, and Schedule Performance Index, aren’t four separate numbers. They’re four different views of the same three inputs, and explaining them out of order is the single most common mistake in project management KPI writeups.
Start with Planned Value (PV): what you expected to have spent, or accomplished, by this point in the schedule. Then Earned Value (EV): what you’ve accomplished, measured in the same budget terms, regardless of what it cost to get there. Then Actual Cost (AC): what you spent to accomplish it. Every downstream ratio comes from comparing these three.
If you’re studying this cluster for the PMP exam rather than reporting it to a steering committee, PMA’s own exam-focused breakdown of earned value walks through the same three inputs from that angle.
Cost Variance is earned value minus actual cost: did you spend more or less than the work you completed was worth? Cost Performance Index is earned value divided by actual cost: the same comparison, expressed as a ratio, where anything under 1.0 means you’re spending more than planned for the work you’re getting. Schedule Variance is earned value minus planned value: are you ahead of or behind where the schedule said you’d be? Schedule Performance Index is earned value divided by planned value, the ratio version of the same question.
The double-counting mistake happens when a report introduces Cost Variance or Schedule Performance Index without ever stating what earned value itself is, as if CPI and SPI were independent measurements rather than two lenses on one number. If a stakeholder asks where CPI comes from and the honest answer is “it’s calculated from three other things,” say what those three things are before showing the ratio. It takes one extra sentence, and it’s the difference between a report that holds up under a follow-up question and one that doesn’t. None of these four ratios carry the same weight in every project, though, which is the next thing worth sorting out.
Matching KPIs to Your Project Type
Not every category from the 33-KPI table above applies the same way to every kind of project, and the vendor pages ranking for this topic rarely say so.
| Project Type | Schedule | Cost | Quality | Resource | Stakeholder/Risk |
|---|---|---|---|---|---|
| Software/IT delivery | Applies directly | Applies directly | Defect and test-based | Velocity-based | Applies directly |
| Construction/capital | Applies directly | Applies directly | Inspection-based | Applies directly | Applies directly |
| Internal transformation/operations | Applies directly | Limited, no client billing to measure against | Applies directly | Applies directly | Adoption-focused |
| Agency/client-billable | Applies directly | Margin and utilization-focused | Applies directly | Utilization-heavy | Limited, internal stakeholders only |
The gap that matters most is cost. If you’re running an internal transformation or operations project with no client invoice attached, a KPI built around profit margin or billable utilization actively misleads whoever’s reading it. Once you know which categories apply, building the dashboard that surfaces them instead of a generic template is the next design decision, and it’s a different problem than picking the KPIs themselves.
Setting Defensible KPI Targets and Tolerances
A KPI that survives the project-type check above still isn’t finished: every one of the 33 KPIs eventually needs a target. The number itself only tells you where you are; the target is what turns it into a decision. Where that target comes from determines whether it will survive a challenge.
A small number of these targets are genuinely PMI-anchored. The Project Management Institute’s own guidance treats a Cost Performance Index or Schedule Performance Index near 1.0 as on-plan by definition, since that’s what the ratio’s construction means; a sustained reading meaningfully below 1.0 signals a real problem regardless of industry. That part of the target is math, not opinion.
Almost everything else has to come from your own project’s history rather than an external number, and that’s a legitimate method, not a fallback. You should set a defensible milestone-miss tolerance, an acceptable range for scope change requests, or a reasonable resource utilization target against how your own organization’s comparable projects performed over two or three prior cycles, not against a number pulled from a blog post about a different industry.
And a few targets circulating in project management content have no legitimate source at all. You should treat a specific delivery-margin percentage, a hard cutoff for schedule variance, or a flat “industry benchmark” cited with no organization, year, or methodology behind it as unsupported, whatever site it appears on. The honest answer, when a stakeholder asks for an industry benchmark that doesn’t exist, is that no defensible cross-industry number exists for that particular ratio, and the target has to come from the project’s own baseline instead.
That answer holds up. A borrowed number that turns out to have no source behind it does not, and it’s the kind of thing that surfaces in exactly the follow-up question a status report is supposed to survive.
Reporting a Baseline Change Without Losing Stakeholder Buy-In
Once a target is set the way the previous section describes, the next test is what happens when the plan behind it moves. A baseline change is the conversation every project manager eventually has to run, and it goes wrong less often because of the math than because of the specific behaviors that keep a steering committee calibrated rather than defensive. The moment a scope change or a schedule slip forces a new baseline, the question that determines how the conversation lands is simple: what’s the new agreed budget, and what are the agreed deadlines, stated plainly rather than buried in a revised Gantt chart nobody reads line by line.
The failure mode to watch for is a steering committee that approves every revision without asking why. When that happens, the variance you’re reporting against the current baseline stops meaning much, because you’re measuring it against a moving target rather than the plan your leadership held you to. Reporting cost or schedule variance against a baseline the steering committee rewrites every time it’s inconvenient is a number without a fixed point behind it.
What Justifies a Rebaseline (and What Doesn’t)
Not every schedule slip or cost overrun justifies moving the baseline, and one of the few publicly available standards to say so plainly is the Georgia Technology Authority’s project re-baselining guideline (GM-22-001, most recently reviewed in 2022). The Georgia Technology Authority wrote it for state IT governance specifically, not as a universal standard, but the distinction it draws holds anywhere: an approved scope change, a contract amendment, a high-level estimate that genuinely needed refinement once the team selected a vendor, or a team that has exhausted the standard recovery techniques and still can’t close the gap are legitimate reasons. Poor performance and poor planning are explicitly not. If the honest reason a baseline needs to move is that the original plan was wrong, that’s worth saying directly, since a plan that was wrong from the start is a different conversation than a scope change is, and treating the two the same is what erodes the trust a re-baseline depends on.
How KPIs Get Gamed and How to Prevent It
The same honesty problem shows up on the reporting side too. Tie a KPI to a reward, and people eventually optimize it rather than improve it, which is what the metric is for once someone’s evaluation depends on it. Goodhart’s Law, named for the economist Charles Goodhart, who first observed it in a 1975 paper on UK monetary policy, names the pattern directly: once a measure becomes a target, people start managing to the measure instead of the outcome it was supposed to represent. A project manager who commissions cycle-time tracking to reward a fast-moving team can end up with a team that closes tickets quickly on work that was never going to ship anything real, because the tracker never distinguished busy from productive.
Watch for these patterns specifically:
- Task-splitting: breaking one unit of work into several smaller ones to inflate a completion-rate KPI
- Scope narrowing: meeting a quality or acceptance KPI by trimming what counts as done informally, not by improving the work
- Reporting-period gaming: shifting real progress across period boundaries to smooth a metric that would otherwise show a dip
- Proxy substitution: optimizing a measurable proxy, like ticket volume, instead of the outcome it was meant to stand in for
None of this means the KPI is a bad idea. It means a KPI reported without knowing what behavior it rewards is incomplete, and the fix is usually cheap: pair the number with a second one that would catch the gaming, and say out loud, when you introduce a new metric, what behavior you’re afraid it might encourage.
Report the Seven, Not the Thirty-Three
The 33 KPIs in this guide cover the field completely, which is exactly why nobody should report all 33. Knowing that Cost Performance Index and Schedule Performance Index exist is the easy part. The real skill is knowing which seven of the thirty-three belong in front of your leadership this quarter, which targets you can defend with a PMI formula, which ones only your own project history can justify, and which numbers making the rounds online have no defensible source at all.
Unsourced numbers get repeated because they sound authoritative. The right move is to say plainly that no defensible number exists for that particular claim, and to set the target from what your own project’s history can support. That’s a harder answer to give in a meeting. It’s also the one that survives the follow-up question.
Would the seven KPIs on your last status report survive that same question from your own leadership?
Project Management Academy’s Advanced Project Management Workshop builds the judgment behind the formulas, the part that lets you answer that honestly.
Frequently Asked Questions
The questions below return to the basics on purpose, since a reader who jumps straight to this section shouldn’t have to read the rest of the guide first to get a straight answer.
What is a KPI in project management?
A key performance indicator is a number that measures whether a project is on track against its cost, schedule, quality, or scope goals. Tracking a risk, issue, or dependency doesn’t make it a KPI; a KPI is the output those inputs eventually show up in.
What are the most important KPIs for project managers?
Schedule Performance Index, Cost Performance Index, Estimate at Completion, Percentage of Milestones Missed, Number of Open Risks, Approved Change Request Percentage, and Stakeholder Satisfaction Score cover schedule, cost, risk, scope, and trust without overloading a status report.
How do you set a KPI target if there’s no industry benchmark?
Set it against your own organization’s comparable past projects, tracked over two or three prior cycles, rather than an unsourced figure from vendor content. For a few ratios, like Cost Performance Index near 1.0, PMI’s own formula gives you the target directly.
When is it okay to change a project’s baseline?
An approved scope change, a contract amendment, a refined high-level estimate after vendor selection, or exhausting standard recovery techniques all justify a re-baseline. Poor performance or poor planning on their own do not.


 Influencing Without Authority
 (877) 637-0450
 contact@projectmanagementacademy.net
 Mon - Fri | 8:00 AM - 6:00 PM EST


 New Horizons
 Project Management Academy
 Velopi
 Six Sigma Online
 TCM Security
 TRACOM
 Watermark Learning